Do You Really Know What Drives Your Referral Traffic from Pinterest?
There’s a good deal of confusion about what drives traffic from Pinterest to blogs and websites. An individual site will often see ebbs and flows in Pinterest traffic month to month or week to week. When this happens, it’s easy to jump to conclusions as to why traffic from Pinterest increased or declined. If you do that, though, you’ll generally be wrong.
The thing is: Pins can take weeks or months to go viral. This makes interpreting changes in traffic from Pinterest more difficult than it is for real-time social networks such as Twitter or Facebook. Often, a growth or decline in traffic from Pinterest is NOT due to something you did recently, but the impact of actions taken months prior.
This blog post provides an in-depth analysis of what drove one successful blogger’s traffic from Pinterest to change over time.
I’ve gone into great detail using screenshots from her Google Analytics account (with her permission, of course!), so that you’ll be able to repeat the steps below with your own data. The first time you do it may take 20-30 minutes if you’re newer to Google Analytics. I’d strongly recommend you spend that time, though. The insights may change your Pinterest strategy forever.
To make understanding your Pinterest traffic easier, we’ve created a FREE printable step-by-step guide. Download it to follow along with your own traffic data.

Download this free printable guide to better understand your traffic from Pinterest: https://tailwindapp.com/blog/traffic-from-pinterest/
Drive More Traffic with Tailwind’s Keyword Finder
Getting traffic from Pinterest starts with using the right keywords. With Tailwind’s powerful keyword research tool, you can discover what your audience is searching for, ensuring your pins and boards stand out and drive clicks.
Stop guessing and start optimizing your content. Try Tailwind’s Keyword Finder today and unlock the full potential of Pinterest!
Hands-on case study: Louisem.com
Recently, Tailwind member Louise Myers of louisem.com wrote in with a question that caught my attention:

In aggregate, our members see a substantial improvement in traffic from Pinterest after they start using Tailwind. I take great pride in that fact. But it’s equally important that we understand what’s going on in cases when our members aren’t seeing the results they’re hoping for. By doing so, we not only learn how to help them, but also generate ideas for new features that will benefit all Tailwind members.
What was different for Louise in particular? Why was her traffic from Pinterest declining? Was it somehow our fault? Did we guide her down the wrong path? I needed to know.
So, I spent a good part of the weekend investigating the issue and outlining the process- for her to repeat in the future. However, when we talked her through the results they were so interesting that she immediately said: “A lot of bloggers could benefit if they knew this.” And this blog post was born.
Step 1: Let’s see how Louise’s traffic from Pinterest trended over time to get a sense of the problem we’re trying to solve. We looked at a full year to see if any abnormal seasonal trends pop out.

Looking at this chart the issue in question is clear. There is a nice bump in Sessions referred from Pinterest starting in May, peaking in late July and declining back to prior levels by November. This size of the bump is pretty substantial: 2,847 weekly sessions from Pinterest at the highest point, which was up 4x from ~700 per week in March-April.
See your own in Google Analytics, go to: Acquisition > Social > Network Referrals, then click “Pinterest” in the table. The navigation menu should look like this:

Step 2: Where is traffic coming from within Pinterest? Getting a quick sense of which pages are driving the traffic can hep us figure out what caused the rise and subsequent decline. Was it from the Smart Feed? Search results? Individual pins?
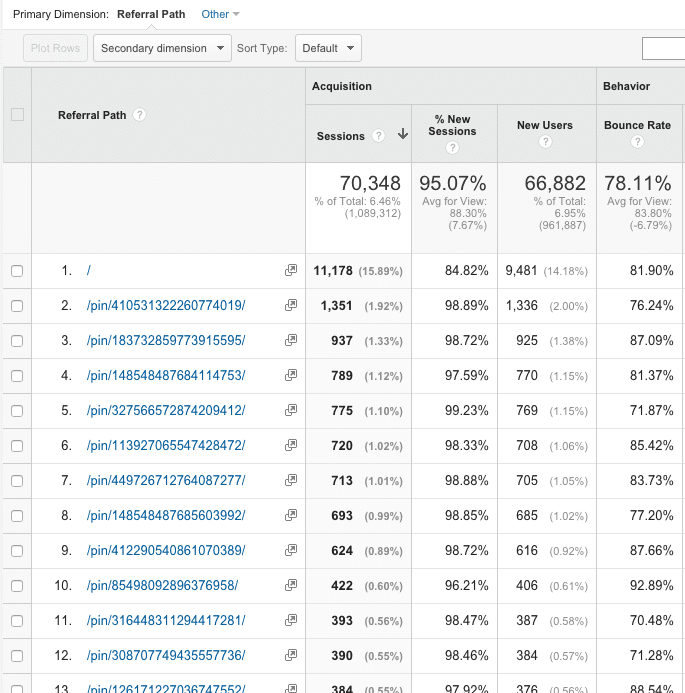
Row 1, which reads “/” refers to the homepage, where the Pinterest Smart Feed is shown. ~16% of traffic referrals came from the Smart Feed. Some quick math tells us that is too small to account for a 2-4x increase in traffic for 5-6 months of the year. However, it’s also far more referrals than any single pin drove during the year. So, it’s worth looking into to make sure we don’t miss an important clue- for instance, if the louisem.com domain might have been penalized or flagged as SPAM.
See your own in Google Analytics, go to: ACQUISITION > All Traffic > Referrals > and click on the “pinterest.com” link.
Step 3: To isolate just referral traffic from the Pinterest Smart Feed, click on the “/” link in the table above.

Okay, this is a good sign! Traffic from the Smart Feed is pretty consistent year round. There’s no sign of any penalties or major changes for the domain. The one noticeable dip is around Christmas time, and was likely driven by Pinterest pushing more holiday/seasonal pins in the Smart Feed, or perhaps simply lower user activity while people were offline for the holidays.
Step 4: Now, we can conclude the bump and decline in traffic is related to traffic coming from individual pins, not the Smart Feed. Since there aren’t any really big outlier pins (e.g. 5+% of traffic), the issue must be wider than say if a single hyper-viral pin surged and declined. Let’s investigate further by looking at how many pins drove traffic in each month…
Pins driving traffic to louisem.com by Month, in Thousands
| Month | Jan | Feb | Mar | Apr | May | Jun | Jul | Aug | Sep | Oct | Nov | Dec | Jan |
| 1,000s of Pins | 1.3 | 1.2 | 1.3 | 1.3 | 1.6 | 2.7 | 4.5 | 4.6 | 3.2 | 3.6 | 2.1 | 1.3 | 1.6 |
WOW – louisem.com hit a hot streak from June to October 2015! The number of pins driving traffic to the site more than tripled from prior levels!
See your own in Google Analytics: Go back to the chart in Step 2 above and change the date range to cover a specific month. Then look at the total number of rows at the bottom to get a ballpark estimate of how many unique pins drove traffic to your site in that month. Here’s what that looked liked for Louise when we looked at just January 2015:

Step 5: This is really interesting. Seeing so many more unique pins driving traffic to Louise’s blog mid-year suggests that something went viral around that time. At the same time, we know from Step 2 above that no single Pin drove more than 1.92% of the Pinterest referral traffic for the year. So, instead of analyzing the lifespan of each pin one by one, let’s look at if any particular blog post on louisem.com went viral.

EUREKA! The top article drove almost half of Louise’s traffic from Pinterest in the past year! The next two account for over 25% more. So, just three articles drove about three quarters of her traffic from Pinterest!
See your own in Google Analytics, go to: This view is the table under the line graph if you followed Step 1 above.
Step 6: Let’s see if Pinterest referral traffic to these three big articles corresponds with the mid year bump.
See your own in Google Analytics: Click on the Shared URL in the table from Step 5 for each URL you want to investigate.
URL 1: Best Inspirational Quotes

URL 2: Color Psychology Brand Colors

URL 3: The Psychology of Color

EUREKA! URL 1 has a rise and fall almost identical to the mid year bump. From June to October, that one URL drove nearly two-thirds of all traffic from Pinterest! Looking at the magnitude of this URL’s referral traffic from Pinterest, the peak in late July is ~2,100 weekly sessions. That’s IDENTICAL to the growth from ~700 weekly sessions to 2,800 weekly sessions observed for all Pinterest traffic to louisem.com.
So, the entire bump in traffic (and subsequent decline) can be explained by one viral post!
In fact, when we remove that one post from the overall Pinterest referral report, the trend looks very different. The bump has disappeared!

Step 7: Just to be safe- let’s confirm if that first “Best Inspirational Quotes” post did indeed go viral.

Wow! 60.2k Pins! I’d say that’s viral…
/ AN IMPORTANT ASIDE
Notice that this post was published on April 8th, 2015. Yet, it didn’t start going viral until late May and peaked at the end of July. It took a month and a half for this post to go viral and nearly 4 months for it to hit its peak! Then, it continued generating substantial traffic for many months after. Think about how that compares to most blog posts, facebook status updates or tweets, which will tend to peak within 24-72 hours of publication.
I raise this point because there’s an ongoing debate about whether or not you should delete pins- and it’s being debated without data to back up the various opinions. In an Online Blog Con webinar just this week, our Marketing Manager Melissa and host Karyn were asked by an attendee if she agreed with some bad advice previously given from the creator of a certain black/grey hat scheduling bot to delete any pin that had not gone viral within four days. Louise’s example in this blog post and many other viral pins like it give plenty of reason NOT to hastily or automatically delete Pins. I personally had a pin go viral on my account about six months ago; it had ZERO repins two weeks after it was pinned, but has since grown to more than 6,000 repins! So, in short, don’t believe everything you read. Look for hard data to support opinions. If someone can’t offer it, they are likely just repeating something they heard elsewhere. And be skeptical of advice that suggests fully automating any aspect of social media. I’ve yet to see anyone reach true long-term success via automation on any social platform.
END ASIDE /
Step 8: Okay- we know this one post was behind both the rise and fall of Louise’s Pinterest referral traffic as it went viral and then died down. But how did it go viral in the first place? Who pinned the pins that sent it viral? Let’s analyze the most viral pins linking back to the Inspirational Quotes post.
| Pin URL | Visits | Repins | How Long Ago? (wks) | Pinned by You |
| pinterest.com/pin/410531322260774019/ | 1,380 | 2,637 | 26 | No |
| pinterest.com/pin/327566572874209412/ | 666 | 1,128 | 37 | No |
| pinterest.com/pin/148548487685603992/ | 648 | 1,746 | 38 | Yes! |
| pinterest.com/pin/316448311294417281/ | 423 | 681 | 37 | No |
| pinterest.com/pin/308707749435557736/ | 362 | 597 | 24 | No |
| pinterest.com/pin/555279829033637547/ | 344 | 589 | 24 | No |
| pinterest.com/pin/447474912955290196/ | 300 | 889 | 9 | No |
| pinterest.com/pin/277041814554189295/ | 198 | 192 | 30 | No |
| pinterest.com/pin/474848354438976775/ | 185 | 228 | 25 | No |
| pinterest.com/pin/302867143668919305/ | 168 | 275 | 25 | No |
All but one of the most viral pins linking to the post were pinned by someone other than Louise. This is common; it is much more likely that other people pinning your content will send your posts viral than you pinning your own content. This is one reason we started inviting Tailwind members to submit their content to our Suggested Content library circulated to other members. By surfacing our members’ content to other members in contextually relevant ways, the number of unique Pinners organically pinning from each members’ content grows, signaling high content quality to Pinterest.
Also noteworthy: Almost all of these pins were pinned 24 to 38 weeks ago, or between May 3 and August 15, 2015.
Note: This data is not from Google Analytics. It can be obtained through the “Most Clicked Pins” report in Tailwind (see Monitor Your Domain section), or recreated manually by visiting each pin one by one and recording the relevant data.
Commentary – Why do Viral Pins fade?
This is a good question with a very complex answer. The simplest analogy is perhaps to think of Pins in the context of other popular media. Eventually, the best movies get removed from theaters, top TV series come to an end and hit songs fall out of the Top 40. They may be replayed forever on-demand, in syndication and on “oldies” stations, but not with the same frequency or audience size they once enjoyed.
Even the most viral pin must eventually trail off. Once a user has seen a given Pin a certain number of times, it becomes less and less likely they will engage with it. As that engagement rate declines, it’s only correct for Pinterest to show other Pins in its place. Think of how boring Pinterest would be if you saw the same fifty viral Pins everytime you logged on. That certainly wouldn’t align with Pinterest’s mission to help you discover and save creative ideas.
The implication for all of us is clear: To succeed over the long-term, you must continually create new, high quality content that your audience will love.
Conclusions
So, what does all this mean for Louise?
Louise now knows exactly why her traffic grew so quickly from May to July- and why it came back down to earth from August to October. One highly viral post exploded and eventually faded off, after many many people had seen it. To get back to those heights, she needs to focus first and foremost on creating more excellent content that people will love and share.
Did Tailwind cause the growth and/or decline in traffic- or was the timing merely coincidence?
We can say for certain that neither the rapid growth in traffic from Pinterest, nor the subsequent decline was caused by Tailwind. The pins that drove the growth in traffic were actually pinned before Louise started using Tailwind. And, remember, all but one of the viral pins was pinned by other Pinners, rather than by Louise herself.
What does all this mean for you, who has valiantly persevered to the end of this post?
Realize that this is the nature of Pinterest. Pins live forever and it often takes months for Pins to really go viral. So, you can’t judge tomorrow’s results based on what you did today.
Rather, you should think about Pinterest like planting a garden. Planting seeds today by creating and pinning great content will drive the value of your harvest months later. The exception to this is Promoted Pins, which are designed to enable more immediate and obvious results by letting you buy promotion right now for specific content.
In this analogy, Tailwind is one of your gardening tools. It can save you a lot of time, help improve your results and allow you to plant more seeds with less effort. If you save even one hour of time per week by Pinning more efficiently, it pays for itself in no time- and you should see a more robust harvest as the seasons go by.
If you’ve been thinking about upgrading to Tailwind Plus, I’d like to offer you a special reward to thank you for reading this long, detailed post. 🙂
Use this link to create your Tailwind account and you’ll start with a $15 credit. That will either cover your first month of Plus or take a nice chunk out of the Annual Plus plan, so you end up getting 5 months free instead of 4. Once you’re a member, you’ll also get your own referral link to earn an additional $15 for every paid member you refer. It doesn’t take many referrals to rack up a free year of Plus service!
Enjoy and happy Pinning!
Pin me: